
Dentistry Is Losing the Health Care Wallet, and It Has Been for a Decade
Aug 09, 2026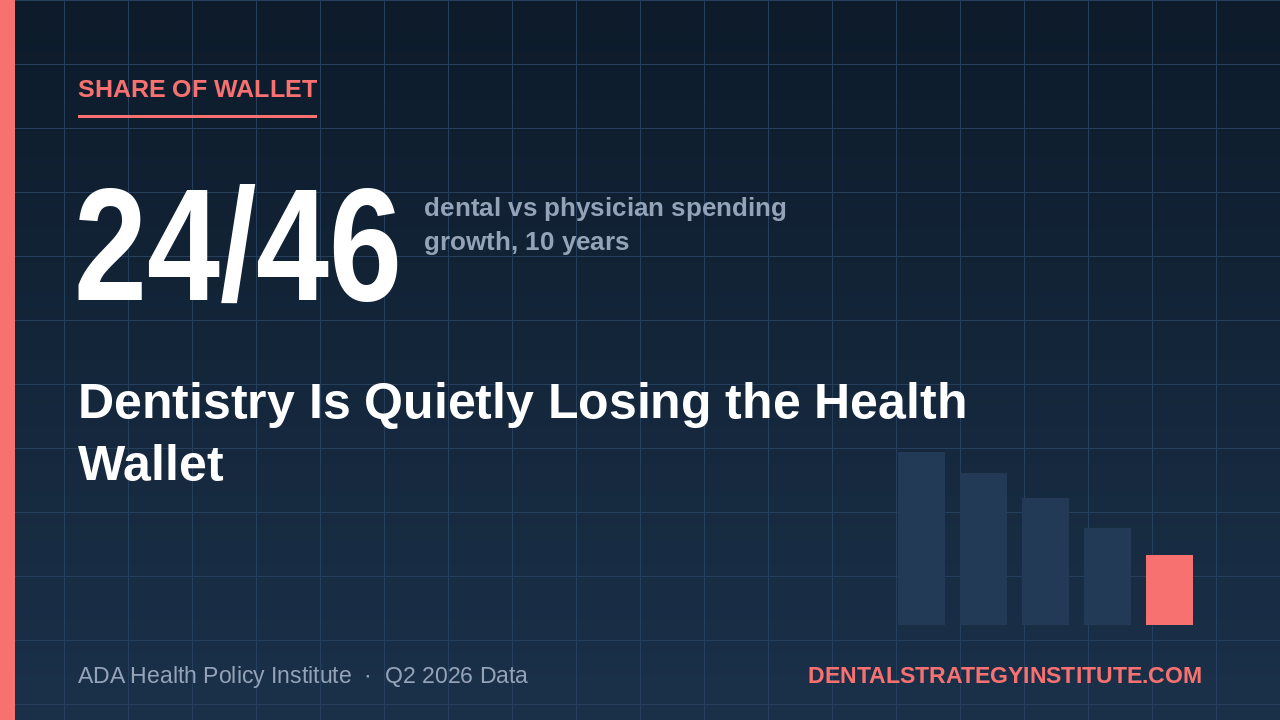
Most of what gets written about the dental economy is cyclical. Good quarter, bad quarter, confidence up, confidence down. The ADA's Q2 2026 report contains one chart that isn't cyclical at all, and it's the one I'd put in front of anybody making a ten-year decision about this industry.
Over the decade from January 2016 to May 2026, inflation-adjusted consumer spending on physician services rose 46%. Spending on health care overall rose 39%.
Spending on dental services rose 24%.
That's not a bad quarter. That's a decade of steadily losing ground inside the same household budget.
What a fifteen-point gap actually means
Households didn't stop spending on health. They spent more, substantially more, in real terms after adjusting for inflation. They just directed a shrinking share of it toward the dental chair.
Compounded over ten years, the gap between dental at 24% and health care overall at 39% represents an enormous amount of money that flowed somewhere else. Had dental simply tracked the broader health care category, the sector would be materially larger than it is — and every practice in the country would be operating with more room than it currently has.
The most recent data doesn't suggest the trend is breaking. Consumer dental spending in May 2026 was up 1% over twelve months, up 0.4% year to date, and down 0.1% from the month prior. It sits about 11% above pre-pandemic levels, which sounds respectable until you notice we're six years past 2020 and inflation alone ran 27% over five of them.
Dentistry isn't shrinking. It's just growing slower than everything it competes with for the same household dollar, year after year, and slow relative decline is the hardest kind to notice from inside a practice.
Four reasons this keeps happening
I've argued about this for years with people who know more health economics than I do, and I think there are four forces at work. None of them is going to reverse on its own.
Benefit design froze in 1974. The typical annual maximum on a dental plan is somewhere between $1,000 and $2,000, which is roughly where it was when I was in grade school. Medical insurance has no equivalent structure. A $40,000 surgery gets covered subject to deductible and coinsurance; a $6,000 dental treatment plan hits a hard ceiling and the patient eats the rest. That single design choice caps how much of household health spending can ever route through dental benefits, and it has effectively transferred the cost of comprehensive dentistry onto patients over five decades of inflation.
Dental sits outside the medical system. Separate insurance, separate records, separate providers, separate everything. Medicare doesn't cover routine dental. When health care policy expands coverage, dental typically gets carved out or added as a limited afterthought. Structural exclusion at that scale compounds.
Discretion is the killer. A cardiologist tells you that you need a stent and you get a stent. A dentist tells you that you need a crown and a meaningful percentage of patients decide to think about it. That discretion is exactly what shows up when consumer sentiment hits 48.0, and it's why 24.6% of pessimistic dentists in this survey named patients being unwilling or unable to prioritize dental care as their reason.
Nobody's paying for prevention properly. Medicine has spent fifteen years building reimbursement models around outcomes and prevention. Dentistry still gets paid per procedure, which means the enormous preventive value the profession creates has almost no route into how it gets compensated.
The reimbursement side is the same story
Slide 18 of the report tells the payer half of this, and it rhymes.
Since January 2021, the reimbursement rate index across all payer types rose 19% while inflation ran 27%. Providers are receiving less in real terms per unit of service, and the gap widened again in the first half of 2026 — reimbursement up 1.1% against inflation of 1.8%.
Put the two charts together and you have the whole structural problem in one picture. Volume growing slower than health care generally, and price per unit growing slower than inflation. Both sides of the revenue equation losing ground simultaneously, for a decade.
That's the environment. Everything else in this report — the fiscal squeeze, the equipment deferral, the reluctant insurance decisions, the sudden interest in administrative AI — is a rational response to it.
Where practices and DSOs read this differently
Independent owners tend to experience this as a local problem. Patients seem more price sensitive, case acceptance feels harder, the schedule fills with hygiene. It registers as something happening in their town, or worse, as something they're doing wrong.
It isn't local. It's a decade-long national trend showing up in one building.
That reframe matters, because the solutions are different. If your case acceptance problem is a market-structure problem, then better scripting helps at the margin but won't reverse it. What actually moves the needle is expanding what you can offer inside the same relationship, and financing the gap between what insurance covers and what treatment costs.
Group practices read this as a portfolio thesis, and it explains a lot of their behavior. Slow organic growth in a sector means growth has to come from acquisition and share capture rather than from riding the market. That's precisely why consolidation accelerates in a low-growth environment, and why the DSO model has expanded fastest during exactly the decade this chart describes.
It also explains the quiet strategic bets. Medical-dental integration, oral-systemic positioning, sleep apnea, and anything that lets dentistry claim a piece of a category growing 39% instead of 24%. Those aren't clinical fashions. They're attempts to get on the right side of this chart.
What I'd actually do about it
Look hard at how much of your production is capped by annual maximums, because that's the ceiling this chart describes, and it sits inside your own practice. If a large share of your treatment plans die at the $1,500 mark, patient financing isn't a nice-to-have. It's the primary tool for accessing spending that benefit design has locked out.
Then consider services that route through medical rather than dental benefits where you're clinically positioned for it. Sleep apnea appliances, certain surgical procedures, TMD in some cases. That's not everyone's practice and I'm not suggesting a wholesale pivot. But medical billing accesses a category growing at 46% instead of 24%, and the practices that figured that out a decade ago are in visibly better shape today.
And be realistic about what the payer environment will give you. Nineteen percent against 27% inflation over five years is not a negotiating problem you can solve with a better letter. Our PPO profitability tool will tell you which of your contracts are actually subsidizing the others, which is the version of this question you can do something about.
One caveat on the data. These are Bureau of Economic Analysis consumer spending figures, which capture household spending on services. They don't perfectly map to practice revenue, and they exclude some categories of payment. The trend is robust across a decade though, and a fifteen-point gap doesn't come from measurement noise.
Dentistry has spent ten years growing while everything around it grew faster. That's the backdrop for every strategic decision in this profession, and it deserves a lot more attention than the quarterly confidence numbers get.
Source: ADA Health Policy Institute, "The State of the U.S. Dental Economy, 2nd Quarter 2026 Update." Spending data from the U.S. Bureau of Economic Analysis, inflation-adjusted, indexed to January 2016. Reimbursement index from the U.S. Bureau of Labor Statistics.
Stay connected with news, offers and updates!
Join our mailing list to receive the latest news, offers and updates from our team.
Don't worry, your information will not be shared.
We hate SPAM. We will never sell your information, for any reason.