The 2026 Fiscal Squeeze: Why Your Revenue Grew and Your Real Profit Didn't
Aug 10, 2026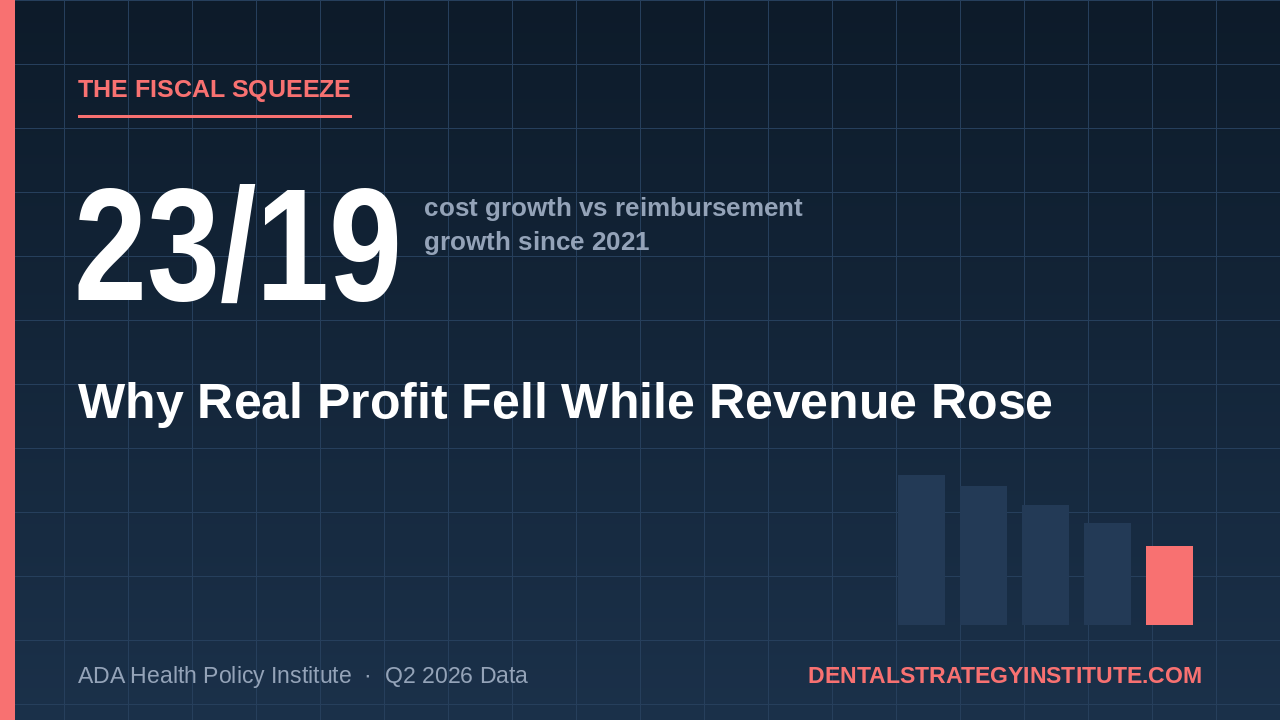
Every quarter the ADA publishes two index numbers side by side and every quarter the industry press reprints them without doing the arithmetic. The Q2 2026 report is no exception.
Here they are. Since January 2021, prices for dental equipment and supplies rose 23%. Hourly earnings for dental office staff also rose 23%. Reimbursement, averaged across all payer types, rose 19%. General inflation over the same stretch: 27%.
The ADA calls this the fiscal squeeze and moves on. Four points between cost growth and revenue growth doesn't sound like a crisis. It sounds like a rounding error you could fix with a decent quarter.
It isn't, and the reason is that those indexes apply to different-sized pieces of your P&L.
Running it through an actual practice
Let me build a simple model. Numbers are illustrative, the assumptions are visible, and you should swap in your own.
Start with a general practice in January 2021. Call revenue 100 and total overhead 60, which puts owner profit at 40. That 60 of overhead breaks into roughly 27 in staff wages, 8 in dental supplies and small equipment, 8 in lab, and 17 in occupancy, admin, insurance, and everything else that keeps the lights on.
Now age it five years using the ADA's own indexes.
Revenue tracks reimbursement, so 100 becomes 119. Wages grow 23%, so 27 becomes 33.2. Supplies and equipment grow 23%, so 8 becomes 9.8. Lab tracks dental producer prices closely enough to use the same 23%, so 8 becomes 9.8. Occupancy, admin, and general overhead track headline inflation at 27%, so 17 becomes 21.6.
Add the cost side back up: 33.2 plus 9.8 plus 9.8 plus 21.6 gives 74.4.
Revenue of 119 minus overhead of 74.4 leaves profit of 44.6.
On paper, that's an 11.5% profit increase. Your accountant will show you a bigger number than 2021 and you'll feel like you're moving forward.
Now deflate it. Inflation ran 27% over this window, so a 2026 dollar buys what 79 cents bought in 2021. Divide 44.6 by 1.27 and you get 35.1.
Against a 2021 baseline of 40, that's a real decline of about 12%.
The number that actually matters
Work the model backward and you get the figure I'd write on the wall.
To hold real profit flat, you'd need 2026 profit of 40 times 1.27, or 50.8. Add overhead of 74.4 and required revenue comes to 125.2. Actual revenue, tracking reimbursement, is 119.
That's a gap of roughly 5%.
Your practice needs about 5% more production than it's currently doing just to stand still in real terms. Not to grow. Not to fund the new operatory. To end 2026 with the same purchasing power you had in 2021.
Is 5% achievable? Sure, on a good year with a strong case mix. Is it achievable in a year when consumer dental spending grew 1% and the University of Michigan sentiment index is parked at 48.0? That's a much harder conversation.
Why the squeeze is getting worse, not better
The most recent slice of data is the part that should bother you.
From January through June of 2026, hourly earnings for dental office staff rose 2.2% while general inflation ran 1.8%. Labor is still outrunning inflation. Meanwhile reimbursement moved 1.1% over the same six months. Wages accelerating, reimbursement decelerating, and the spread between them widening inside a single half-year.
Equipment and supplies were the one bright spot, up just 0.2% over those six months. Which is genuinely good news, though I'd note that a flat producer price index on dental equipment in a year when practices are deferring purchases isn't exactly a mystery.
Five years of this compounds. A four-point index gap in year one is survivable. In year five it's the difference between an owner drawing what they drew in 2021 and an owner quietly wondering why the same practice feels harder.
Where private practice and DSOs actually diverge
The arithmetic doesn't care who owns the building. Both an independent GP and a hundred-location group face the same 23% supply inflation, the same wage pressure, the same reimbursement lag. That part is shared, and anyone selling you a story where consolidation escapes the squeeze is selling something.
Capacity to absorb it is where the paths split.
A group practice buys supplies through a GPO and doesn't pay the 23%. Call it 15%, maybe 12% on high-volume consumables. Rerun the model with supplies growing 12% instead of 23% and profit improves by nearly a full point of revenue. That's a meaningful chunk of margin created by nothing but purchasing volume.
Payer contracting works the same way. A group negotiating on behalf of forty locations has leverage an individual owner will never have, which is why the reimbursement index averaged across the whole market understates what large groups get and overstates what solo owners get. The 19% is a blend. Somebody is above it and somebody is below it, and it isn't the independent in a saturated suburb.
Then there's the piece almost nobody connects. Falling real margins compress independent practice valuations, because valuation runs off EBITDA and EBITDA is what the squeeze is eating. Lower valuations improve acquisition math for buyers. Better acquisition math accelerates consolidation. And consolidation was the fifth-most-cited reason for pessimism among skeptical dentists in this very survey, at 11%.
The fear is self-fulfilling, and the fiscal squeeze is the mechanism that fulfills it. Nobody planned that. It's just what happens when margin compression meets a market with patient capital in it.
What to do with this before year-end
Rerun my model with your real numbers. If your overhead is 68% rather than 60%, the picture is worse than what I showed, because a larger cost base means the 23% applies to more of your revenue. If you're at 55%, you have more room than most.
Then check whether your fee schedule has moved 19% since 2021 or whether it's moved less. Plenty of practices haven't touched UCR in three years and have absorbed the entire spread out of the owner's draw without ever making a decision to do so. That's the quiet way this gets you.
Our dental loss ratio calculator will show you how much of each dollar you're actually keeping, and the PPO cost calculator will show you which contracts are subsidizing which. Run both. The answers tend to be less comfortable and more actionable than people expect.
One honest caveat about my model. It's a model. Real practices have debt service, owner comp structures, and associate splits that change the shape of this considerably. The 12% figure is directional, not a forecast for your building. What survives the sensitivity testing is the direction and the rough magnitude, and both are unpleasant.
The indexes are published quarterly and free. The arithmetic takes ten minutes. I'd argue the reason more people haven't done it is that the answer isn't one anybody wants to sit with.
Source: ADA Health Policy Institute, "The State of the U.S. Dental Economy, 2nd Quarter 2026 Update." Index data from the U.S. Bureau of Labor Statistics. Profit modeling is illustrative and based on stated assumptions.
Stay connected with news, offers and updates!
Join our mailing list to receive the latest news, offers and updates from our team.
Don't worry, your information will not be shared.
We hate SPAM. We will never sell your information, for any reason.