
The Busyness Paradox: Dentists Are Working Harder in 2026 for the Same Money
Aug 05, 2026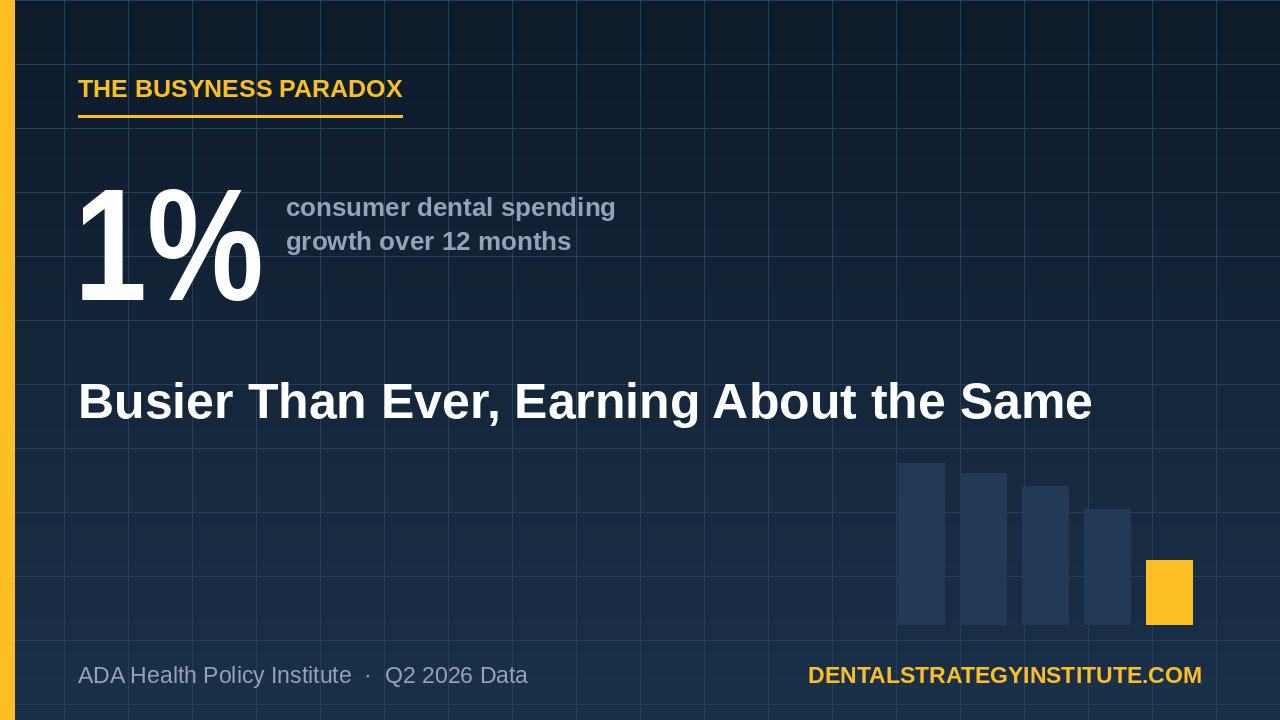
The ADA Health Policy Institute published its Q2 2026 economic report in July, and buried on slide 30 is a sentence I've been chewing on for two weeks. After laying out that dentists are busier and that consumer dental spending grew only 1% over twelve months, the authors offer three possible explanations and then write: "This merits further analysis."
That's researcher for "we noticed something weird and we're not going to touch it."
So let's touch it.
The two numbers that shouldn't coexist
Here's what the Q2 2026 data says about how hard dentists are working. The share of dentists reporting they were "not busy enough" dropped to 26%, down from 32% in Q1 2026 and 33% in Q4 2025. Average new-patient wait times climbed to 13.9 days, up from the prior quarter. The share who treated all their patients without feeling overworked jumped to 41%, the highest reading in the nine quarters the ADA shows.
By every measure in that survey, chairs are fuller than they were six months ago.
Now here's what the Bureau of Economic Analysis says about the money. Consumer spending on dental services in May 2026 came in at roughly $216 billion annualized, inflation-adjusted. That's up 1% from twelve months prior. Up 0.4% year to date. And actually down 0.1% from the month before.
One percent. Over a year. Against dentists reporting meaningfully more activity.
Both of these can't describe a healthy market at the same time.
Three explanations, and only one of them is good news
The ADA floats three possibilities, and they're worth taking seriously because each one leads somewhere completely different.
First is that aggregate national spending simply doesn't map onto individual practice busyness. There's something to this. The BEA measures every dollar households spend on dental services across the whole country, while the HPI survey measures how a few hundred dentists felt about their schedule. Different instruments, pointed at different things. But a 1% spending gain against a six-point swing in busyness is a lot of noise to explain away.
Second is that patient traffic is increasing but for relatively low-value services. This is the one I'd bet on, and I'll explain why in a minute.
Third is that dentists are working harder for the same revenue. Which is really just the second explanation wearing different clothes.
Notice that none of the three is "demand is strong and practices are thriving." The most optimistic reading available in the ADA's own list is a measurement artifact.
Why I think it's the mix
Look at what else is in this report. The reimbursement rate index across all payer types rose 19% since January 2021 while general inflation ran 27%. From January through June of 2026 alone, reimbursement moved 1.1% against 1.8% inflation. Dentists are getting paid less in real terms per unit of work, and that erosion has been compounding for five years.
Then look at the skepticism data. When the ADA asked dentists who were pessimistic about the sector why they felt that way, the number two answer, at 24.6%, was patients being unwilling or unable to prioritize dental care. One respondent put it plainly: "Patients seem to want to spend less on elective care and hold off on regular or critical care."
Stack that against the University of Michigan consumer sentiment index sitting at 48.0. That's a historic low. Households feel broke, and households are the ones deciding whether to greenlight the crown or take the cleaning and go home.
Put those pieces together and a coherent story falls out. Patients are still coming. They're coming for hygiene, for exams, for the emergency that can't wait. They're deferring the quadrant of dentistry, the implant, the full-arch case, the elective cosmetic work. Chairs fill with lower-production appointments. Wait times stretch because the schedule is packed with visits rather than dollars.
Your practice is busier. Your production per hour isn't.
The metric nobody in dentistry actually tracks
Ask a practice owner how last month went and you'll hear about collections, maybe production, maybe new patient count. Ask about revenue per chair-hour and you'll usually get a pause.
That's the number this whole report is quietly about. Total production divided by the hours your operatories were actually occupied. Not scheduled — occupied. If that figure is flat or falling while your schedule tightens, you're running the treadmill faster to stay level, and every additional patient you add makes the staffing and supply math slightly worse instead of better.
Here's the uncomfortable part. Busyness feels like success. It really does. A packed schedule is the most emotionally reassuring signal a practice owner gets, and it's the one most likely to mislead you in a year like this one. I've watched owners treat a full appointment book as proof they didn't need to examine their fee schedule or their case acceptance, right up until the year-end P&L landed and nobody could explain it.
Wait times of 13.9 days can mean demand exceeds capacity. They can also mean your schedule is clogged with appointments that don't pay for the room.
What this looks like from the DSO side
Group practices see this faster, and that's the real structural difference. A DSO with regional dashboards catches a mix shift within a reporting cycle, because production per operatory hour sits on the standard operations review. When hygiene volume climbs and restorative volume sags, somebody in a regional VP role is asking about it by the next month.
Solo owners typically find out at tax time.
Tooling splits the same way. Only 10.1% of dentists in this survey currently use AI for practice analytics or business intelligence, and another 27.2% say they plan to. Roughly six in ten have no intention of instrumenting the part of their business that would catch exactly this problem. Meanwhile the group practice across town runs that analysis as routine and adjusts its scheduling templates accordingly.
Scale doesn't make the mix shift hurt less. It makes it visible sooner, and visible sooner is most of the game.
One advantage runs the other direction, and it deserves naming. An independent owner who spots this can change a scheduling template, restructure hygiene handoffs, or rework a case presentation script on a Tuesday afternoon. A DSO needs a pilot, a regional rollout, and a training cycle. In a year where the only real lever is throughput and mix, speed of adjustment has genuine value.
What I'd do about it before Q3 closes
Pull your last six months and calculate production per operatory hour by month. Not per patient. Per hour of occupied chair time. If that line is flat while your visit count is up, you've confirmed the mix shift inside your own building and you can stop guessing.
Case acceptance comes next. Look specifically at treatment plans over a couple thousand dollars, compared against the same window last year. That's where deferral shows up first, and it tells you whether patients are choosing to wait or your presentation is failing to give them a reason not to.
The fee schedule question comes third, and it's the hardest one. If reimbursement has lagged inflation by eight points over five years and your UCR hasn't moved to match, you've absorbed that spread personally. Our PPO profitability tool exists for exactly this calculation, and I'd rather you run it than take my word for it.
A caution on the data itself. The ADA surveyed 2,432 panel dentists and got 589 responses, of which 552 work in private practice. Respondents skew toward ADA members, practice owners, solo and small group settings, and mid-to-late-career dentists. This is a private-practice-owner read on the market wearing an industry label. Useful, though not the whole picture.
Still, the paradox is real, and the ADA's own analysts flagged it. Busier and flat is not a stable place to sit. Either the mix recovers, or the cost side keeps compounding against a production number that isn't moving, and 2027 gets considerably less comfortable than 2026.
Source: ADA Health Policy Institute, "The State of the U.S. Dental Economy, 2nd Quarter 2026 Update." Spending figures from the U.S. Bureau of Economic Analysis; consumer sentiment from the University of Michigan.
Stay connected with news, offers and updates!
Join our mailing list to receive the latest news, offers and updates from our team.
Don't worry, your information will not be shared.
We hate SPAM. We will never sell your information, for any reason.