
Dental Staff Compensation Benchmarks 2026: What Hygienists, Assistants, and Front Office Actually Earn
Jun 22, 2026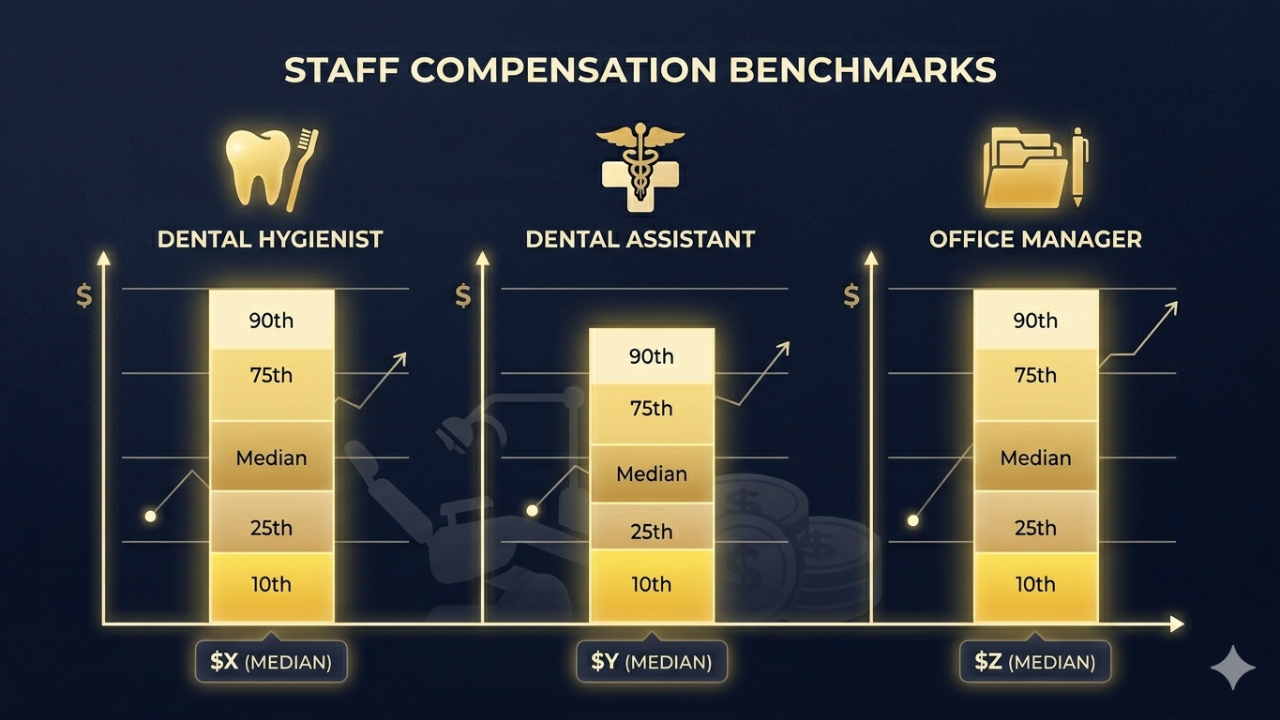
"Are we paying market rate?" is the most frequently asked compensation question in dental practice management — and it's almost never answered with real data.
Most practice owners rely on what their study club says, what a hygienist told them they made at their last job, or a LinkedIn comment from a dental consultant. None of that is a benchmark. It's anecdote.
The DSI Staff Compensation Benchmarker is the first independent, practice-submitted wage database for dental staff by role — covering hygienists, dental assistants, and front office, with regional breakdowns as the dataset grows.
What Dental Staff Actually Earns: The Benchmark Data
Dental Hygienist Hourly Wage
Hygienist compensation is the most consequential staffing cost in most general practices — and the most volatile in the current market.
National benchmark by percentile (base hourly wage, GP practices): | Percentile | Hourly Wage | |---|---| | P10 | $35/hr | | P25 | $42/hr | | P50 (median) | $48/hr | | P75 | $56/hr | | P90 | $68/hr |
Regional variance is significant. Markets like Seattle, San Francisco, Boston, and New York run $10–$20/hr above the national median. Rural Southeast and Midwest markets may run $8–$12 below. The DSI benchmark will show your regional positioning as the dataset builds.
What this means practically: If you're offering $44/hr in a metro market where the P50 is $54/hr, you're not competing — you're hoping. Vacancy duration benchmarks confirm this: practices paying below the 40th percentile wage have vacancy durations 2–3x longer than those paying at or above median.
Dental Assistant Hourly Wage
National benchmark (base hourly, certified DA): | Percentile | Hourly Wage | |---|---| | P25 | $18/hr | | P50 (median) | $21/hr | | P75 | $26/hr | | P90 | $32/hr |
The assistant market has tightened considerably in the last three years. Practices that previously filled positions at $17–$18/hr are now competing with DSOs and corporate practices offering $22–$25/hr with sign-on bonuses. The practices retaining assistants long-term are investing in CE, certification support, and clear advancement pathways.
Front Office Hourly Wage
National benchmark (scheduling/admin, experienced): | Percentile | Hourly Wage | |---|---| | P25 | $17/hr | | P50 (median) | $20/hr | | P75 | $24/hr | | P90 | $30/hr |
Front office compensation benchmarks often get ignored relative to clinical roles. This is a mistake. An experienced scheduler or treatment coordinator who understands insurance billing and case presentation is worth the top quartile rate many times over in production impact.
Staff Cost Ratio: The Number That Ties It Together
Individual wage benchmarks matter — but they need to be read alongside the staff cost ratio: total non-doctor payroll + benefits ÷ collections.
Why it matters: A practice could be paying every role at median wage and still have an out-of-control staff cost ratio if it's overstaffed relative to production volume.
Staff cost ratio benchmarks:
- P25 (efficient): 22–24%
- P50 (median): 26–28%
- P75 (high): 31–33%
- P90 (problematic): 36%+
The target zone is 22–28% for most general practices. Above 32% deserves investigation. Below 18% usually means understaffing that will show up in turnover and burnout.
The True Cost of Turnover
When a dental practice loses a clinical team member, the total cost is rarely visible in the P&L but is very real:
- Direct recruitment costs: Job postings, temp agency fees, signing bonuses — typically $3,000–$8,000 per hire
- Training time: 2–4 weeks of reduced productivity while a new hire gets up to speed
- Lost production: An inexperienced assistant or hygienist typically produces 20–30% below a tenured employee for the first 90 days
- Team morale impact: Harder to quantify, but consistently cited by practice owners as a significant factor in subsequent turnover
Conservative turnover cost estimate: $8,000–$15,000 per departure for a clinical role. The Staff Compensation Benchmarker calculates this based on your actual headcount and departure rate.
Hygienist Vacancy Duration: The Benchmark Nobody Talks About
Hygienist vacancy duration — how long your current or most recent hygiene opening has been unfilled — benchmarks as follows nationally:
- P50: ~30 days
- P75: ~90 days
- P90: 210+ days
If you've been searching for a hygienist for more than 90 days, you're in the bottom quartile of hiring outcomes. The practices filling positions fastest are typically those paying at or above P75 wages, offering scheduling flexibility, and actively recruiting through hygiene school networks rather than waiting for Indeed applications.
Common Questions
How is the staff cost ratio calculated if I use independent contractors for some roles? For benchmark comparability, include all compensation for clinical labor regardless of employment classification. 1099 hygienists should be included at their contracted payment rate.
Should I include employer-side payroll taxes in the staff cost ratio? Yes. Total cost of employment — wages + benefits + employer payroll taxes — is the correct denominator for a meaningful benchmark.
What if I'm significantly above the P75 staff cost ratio but my team is excellent? It's worth knowing which line items are driving it. Often a high ratio is explained by one or two specific decisions (a senior hygienist at long-tenured wages, high health insurance costs) rather than systemic overstaffing. The benchmark tells you where you are; it doesn't tell you the right answer for your practice.
Related Reading
- The Federal Government Just Made It Easier for Your Dental Team to Save for Retirement
- Hygiene Capacity Utilization: What the Benchmark Data Says
- What Is a Good Production Per Operatory Number?
Find out exactly where your wages and staff cost ratio sit relative to peers.
The DSI Staff Compensation Benchmarker shows your wage position by role, your staff cost ratio percentile, your annual turnover cost, and your hygienist vacancy duration — all benchmarked against real contributing practices.
Run Your Free Staff Compensation Benchmark →
Takes under 5 minutes. Free. Regional data improves as more practices contribute.
Stay connected with news, offers and updates!
Join our mailing list to receive the latest news, offers and updates from our team.
Don't worry, your information will not be shared.
We hate SPAM. We will never sell your information, for any reason.