
What Should Dental Practice Overhead Be? Benchmark Data Across All Six Cost Categories
Jun 26, 2026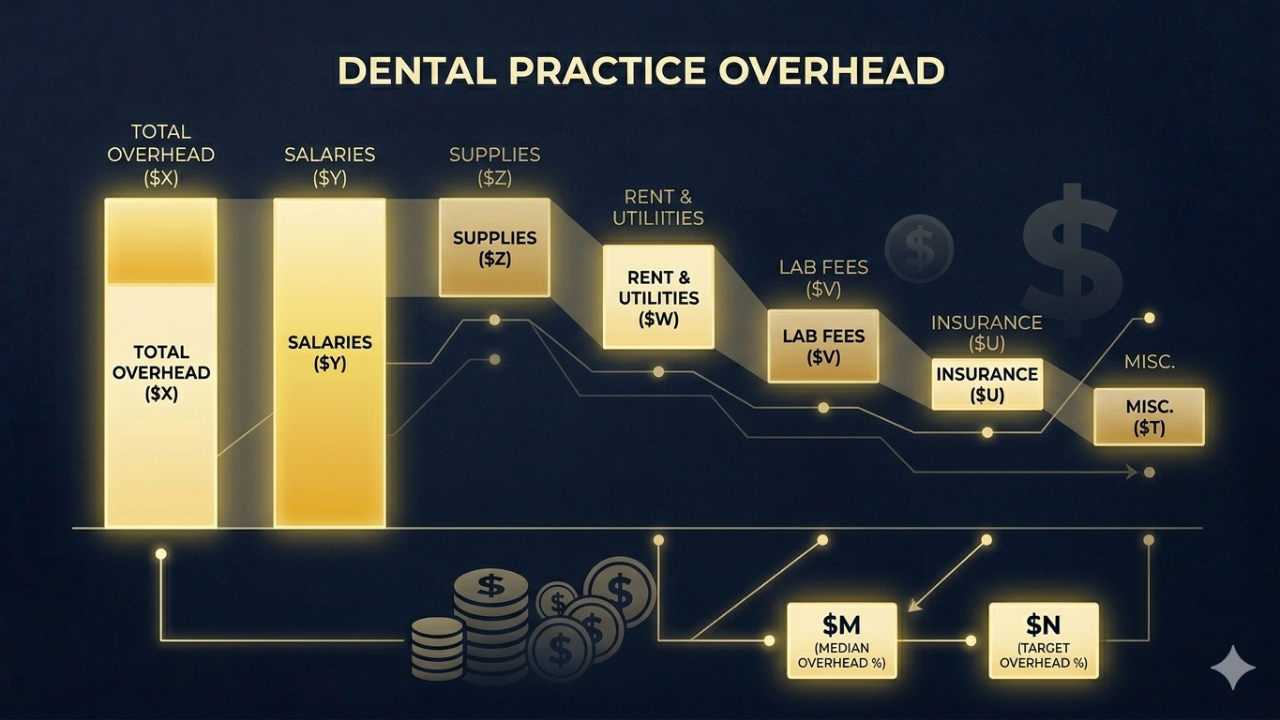
Every dollar a dental practice spends that isn't doctor compensation falls into one of six overhead categories. Most practice owners know their overhead is "too high" — but they don't know which category is the problem, or how their specific mix compares to practices like theirs.
That's the gap the DSI Overhead Analyzer closes.
The Six Overhead Categories That Define Practice Economics
1. Total Overhead Ratio
Total overhead ratio = total operating expenses (excluding doctor compensation) ÷ collections.
This is the headline number — and the one most dentists cite when they say "my overhead is 68%." But the aggregate tells you almost nothing without the line-item breakdown.
National benchmark by percentile: | Percentile | Total Overhead Ratio | |---|---| | P10 (lean) | Below 45% | | P25 | 50–52% | | P50 (median) | 57–60% | | P75 | 64–67% | | P90 (high) | 72%+ |
The academic target often cited ("overhead should be under 60%") roughly corresponds to the national P50. Top-quartile practices run 50–55%. The question is which categories are pulling yours up.
2. Occupancy Ratio
Rent, mortgage principal (if owned), property taxes, CAM charges, and utilities ÷ collections.
Benchmark:
- P25: 4–5%
- P50: 6–7%
- P75: 9–10%
- P90: 13%+
Occupancy above 10% is often the most fixed and hardest-to-fix overhead problem — especially in high-cost urban markets or practices that over-built their footprint. If you're above 12%, it's worth modeling whether a sublease arrangement, reduced operating hours per square foot, or a lease renegotiation is possible at your next renewal.
Practices in DSO transactions: Occupancy ratio is one of the first things acquirers look at. A lease with 8+ years remaining at above-market rates is a liability that gets priced into the deal.
3. Clinical Supplies Ratio
Clinical supplies ÷ collections. This includes all consumables used chairside.
Benchmark:
- P25: 4–5%
- P50: 5–6%
- P75: 7–8%
- P90: 10%+
Above 8% warrants a supplies audit. Common causes: no negotiated pricing with distributors, no supplies manager or accountability for ordering, waste from expired materials, and procedures being performed with premium materials where standard alternatives are appropriate.
DSOs typically drive this to 4–5% through centralized purchasing and GPO agreements. Independent practices can approach 5–6% with disciplined supplier negotiation.
4. Lab Ratio
Outside lab costs ÷ collections.
Benchmark:
- P25: 5–6%
- P50: 7–8%
- P75: 10–11%
- P90: 13%+
Lab ratio varies significantly by case mix. A practice doing significant implant restorations, full-arch cases, or complex prosthetics will run a naturally higher lab ratio. The benchmark is most useful when compared within practice type and case mix — which is why the DSI Benchmark segments by practice type.
If your lab ratio is above 10% and your case mix doesn't explain it, look at: lab unit fees relative to your fee schedule, CAD/CAM in-house production potential, and whether your lab relationships are costing you more than GPO alternatives would.
5. Marketing Ratio
Marketing spend ÷ collections. Includes digital advertising, SEO/content, direct mail, events, and any referral marketing.
Benchmark:
- P25: 1–2%
- P50: 2–3%
- P75: 4–5%
- P90: 7%+
Marketing ratio needs to be read alongside new patient volume. A practice spending 5% of collections on marketing but generating 55+ new patients per doctor FTE per month may have perfectly efficient marketing spend. A practice spending 5% and generating 15 new patients per month has a conversion problem.
The benchmark is neutral on direction — higher isn't necessarily worse if the return justifies it. What matters is the cost-per-acquired-patient metric.
6. Average Operatory Equipment Age
This one isn't a ratio — it's the mean age of your chairs and delivery units across active operatories.
Why it matters for overhead: Older equipment drives up maintenance costs, increases downtime, and affects patient experience (and thus case acceptance). Equipment aged 12+ years typically costs 2–3x as much in annual maintenance as equipment under 5 years old.
Why it matters for practice value: Buyers in DSO transactions or associate buyouts use equipment age as a capex adjustment. If your chairs average 14 years old, an acquirer will budget $30,000–$50,000 per operatory in near-term replacement costs — and that comes out of your valuation.
The DSI Overhead Analyzer captures this metric and benchmarks it against the national distribution. Equipment ages over 12 years on average put you in the bottom quartile and signal a significant capex obligation.
The Overhead Waterfall: Where to Start
When overhead is above the P75, here's the diagnostic sequence:
- Staffing first. Staff cost ratio (the largest overhead component) drives more practices above the P75 than any other single line item.
- Occupancy second. Fixed and hard to change quickly, but the most important to address at lease renewal.
- Lab third. Most directly tied to fee schedule and case mix — often improvable with supplier negotiation.
- Supplies fourth. Manageable with discipline; often neglected.
- Marketing last. Only cut marketing if you have a new patient surplus. Most practices with high overhead also have new patient deficits.
Common Questions
Should doctor compensation be included in overhead? No — and this is the most common benchmarking error. Overhead ratios that include doctor compensation aren't comparable across practices with different ownership structures. DSI excludes it to enable apples-to-apples comparison.
What's a reasonable overhead target for a solo GP? 55–60% is achievable and sustainable. Below 50% is excellent but often indicates a practice with very low staff costs (solo hygienist, minimal support staff) that may be constrained on capacity. Above 65% needs attention.
How is overhead affected by adding an associate? Adding an associate initially increases overhead ratio as you staff up and absorb new-doctor efficiency losses. Over 12–18 months, a productive associate typically drives the ratio down by increasing the collections denominator faster than overhead grows.
Related Reading
- The Hidden Liability in Every Dental Practice Sale: Equipment No One Has Actually Valued
- Dental Equipment Depreciation: What It Means and Why It Matters
- Dental Practice Exit Strategy: What to Do in the 3 Years Before You Sell
- What Is a Good Production Per Operatory Number?
Find out exactly where your overhead sits relative to peer practices.
The DSI Overhead Analyzer calculates all six overhead ratios and your equipment age benchmark — with a waterfall chart showing which categories are in range and which are pulling your score down.
Run Your Free Overhead Analysis →
Takes under 5 minutes. Free. Ten inputs from your P&L and practice profile.
Stay connected with news, offers and updates!
Join our mailing list to receive the latest news, offers and updates from our team.
Don't worry, your information will not be shared.
We hate SPAM. We will never sell your information, for any reason.